Rechargeable Hearing Aid Batteries vs Traditional Options
When you rely on hearing aids every day, the type of battery you use
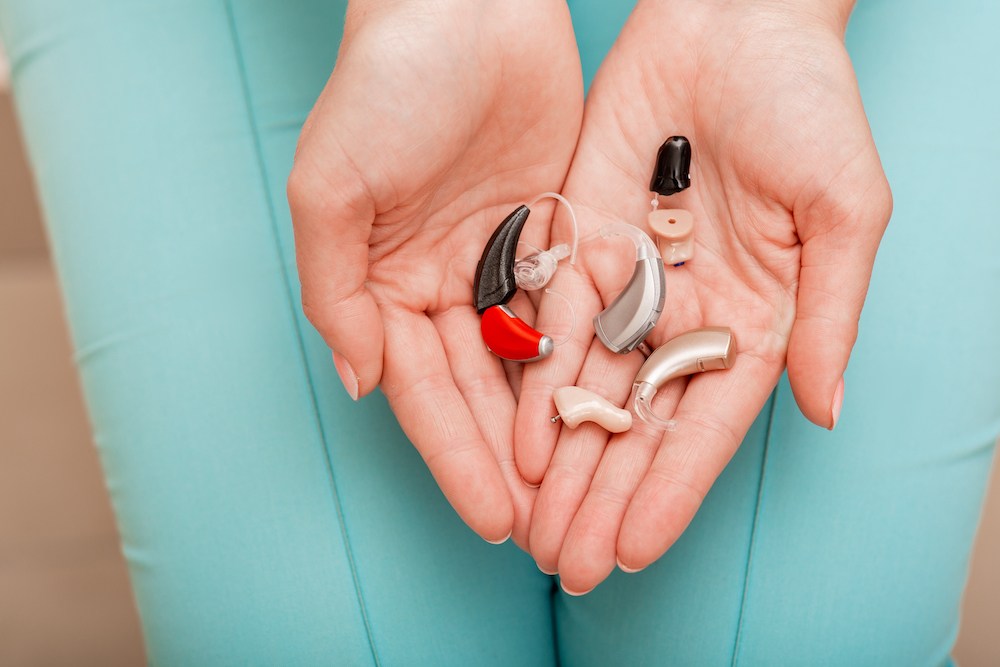
When you rely on hearing aids every day, the type of battery you use
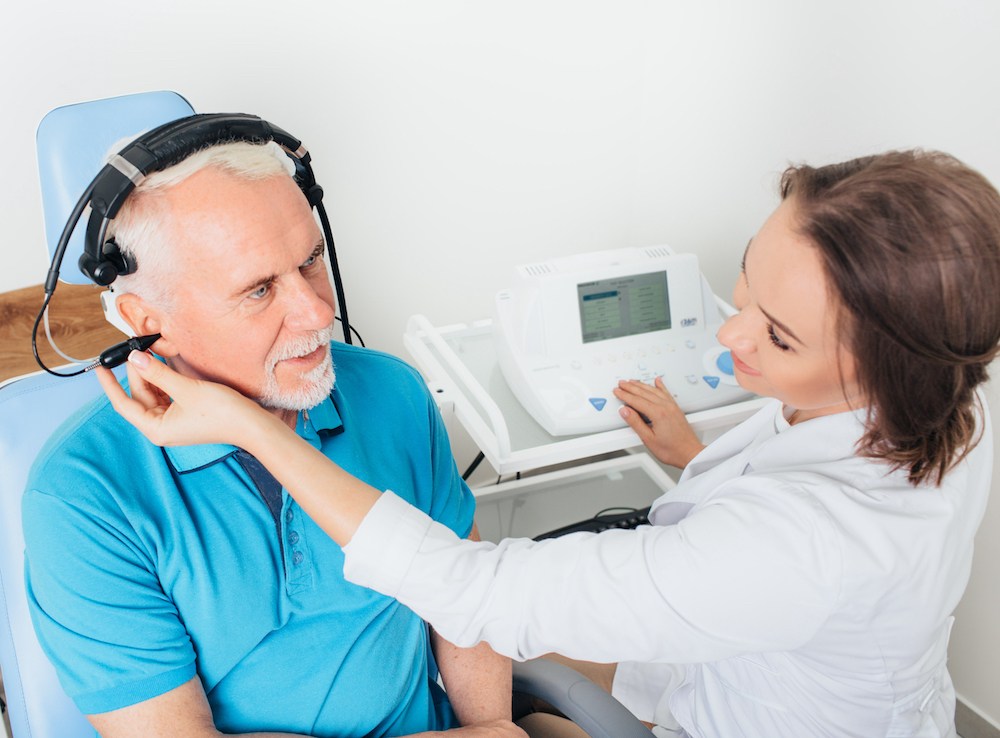
When you schedule a hearing test, it can help to know that it usually

When a student has hearing loss, it can influence how they follow lessons,